All large data sets have problems. The community data gathered in the Between the Fjords projects are no exception – there are inevitable spelling mistakes, synonyms, misidentifications (for example of sterile Carex). Fortunately, having community data from several years, we can compare the community over time to identify and then fix these sorts of problems.
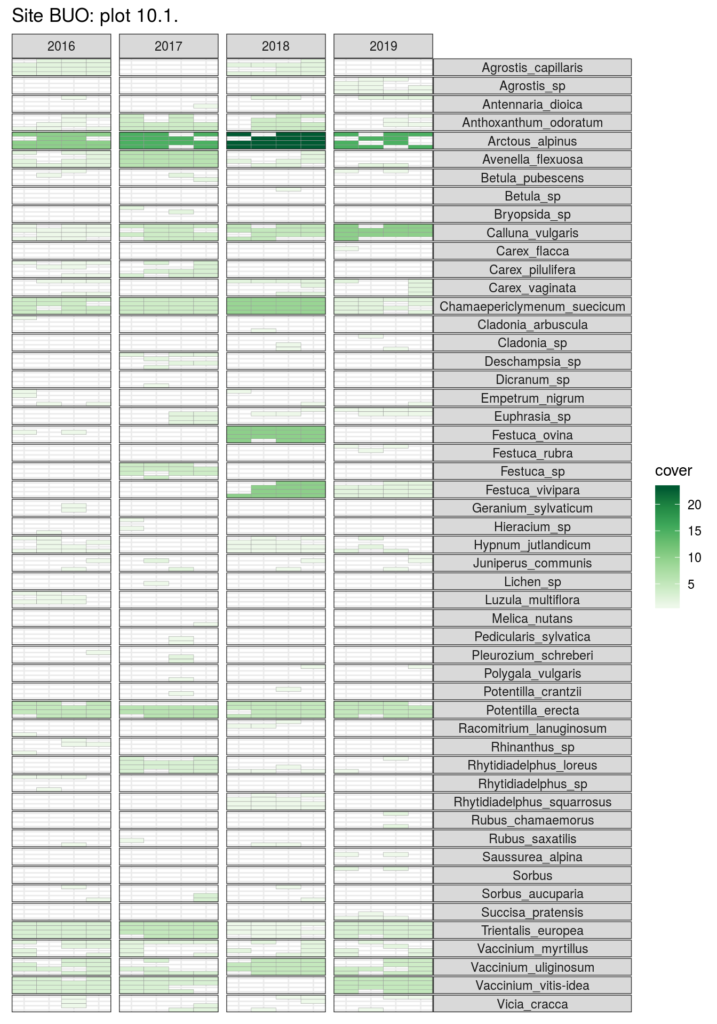
The first step to fixing the problems is to find them and data visualisation is key to this. I’ve written a small R package called turfmapper which takes community data and makes a figure like this.
A cell is coloured if the species in present in that subturf in that year. The intensity of the colour indicated the cover of the species. Species that suddenly appear or disappear might need checking. In this turf, there are problems with Festuca and some other taxa that need fixing.
The vignette in the package shows how to make these figures for all turfs in a project using Rmarkdown.
